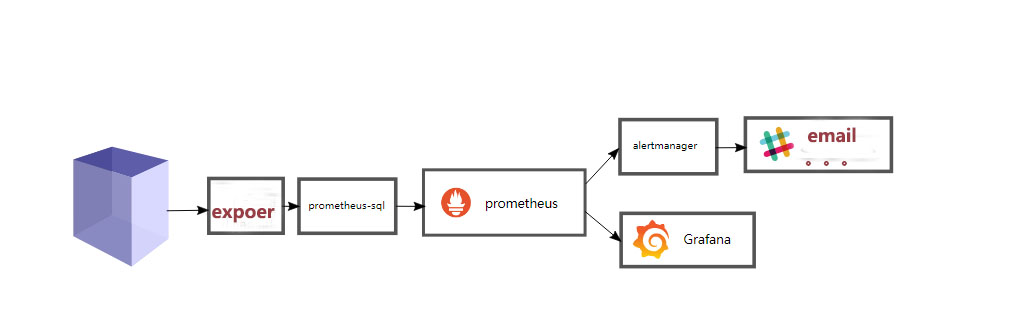
使用Prometheus的blackbox_exporter进行网络监控
Prometheus提供了一个blackbox_exporter可以实现网络监控,支持http、dns、tcp、icmp等监控。
其中9115是这个exporter的http端点的监听端口,blackbox.yml是它的配置文件,需要在其中使用blackbox_exporter的http、dns、tcp、icmp等prober定制配置出各种监测模块(module)。关于blackbox_exporter的配置具体参考Blackbox exporter configuration和Blackbox exporter configuration Exmaple。下面的例子是一个最基本的配置:1 2 3 4 5 6 7 8 9 10 11 12 13 14 15 16 17 18 19 20 modules : http_2xx : # http 监测模块 prober : http http : http_post_2xx : # http post 监测模块 prober : http http : method : POST tcp_connect : # tcp 监测模块 prober : tcp ping : # icmp 检测模块 prober : icmp timeout : 5s icmp : preferred_ip_protocol : "ip4" dns : transport_protocol : "tcp" preferred_ip_protocol : "ip4" query_name : "kubernetes.default.svc.cloud.ctrm" # 利用这个域名来检查 dns 服务器 query_type : "A" # 如果是 kube-dns ,一定要加入这个
在Prometheus的配置文件中配置使用ping module:1 2 3 4 5 6 7 8 9 10 11 12 13 14 15 16 17 18 19 - job_name: 'ping_all' metrics_path: /probe params: module: [ping] static_configs: - targets: 192.168 .1.2 instance: node2 - targets: 192.168 .1.3 instance: node3 relabel_configs: - source_labels: [__address__ ] - target_label: __address__
测试http://127.0.0.1:9115/probe?module=ping&target=192.168.1.2 “1 2 3 4 5 6 7 8 9 10 11 12 13 14 15 16 - job_name: 'blackbox' params: module: [http_2xx] # Look for a HTTP 200 response. static_configs: - targets: http: //prometheus.io # Target to probe with http. - https:/ /prometheus.io # Target to probe with https. http:/ /example.com:8080 # Target to probe with http on port 8080. - source_labels: [__address__] - source_labels: [__param_target] - target_label: __address__
dns监控1 2 3 4 5 6 7 8 9 10 11 12 13 14 - job_name: "kubernetes-service-dns" params: module: [dns] # DNS 模块 static_configs: - targets: kube-dns: 53 - source_labels: [__address__ ] - source_labels: [__param_target] - target_label: __address__
/-/reload(curl -XPOST ip:prom端口/-/reload)使配置生效1 2 3 4 5 6 7 8 9 10 http_basic_auth_example : prober : http timeout : 5s http : method : POST headers : Host : "login.example.com" basic_auth : username : "username" password : "mysecret"
对于使用了Bear Token的服务也可以通过bearer_token配置项直接指定令牌字符串,或者通过bearer_token_file指定令牌文件。
对于一些启用了HTTPS的服务,但是需要自定义证书的服务,可以通过tls_config指定相关的证书信息:1 2 3 4 5 6 http_custom_ca_example: prober: http http: method : GET tls_config: ca_file: "/certs/my_cert.crt"
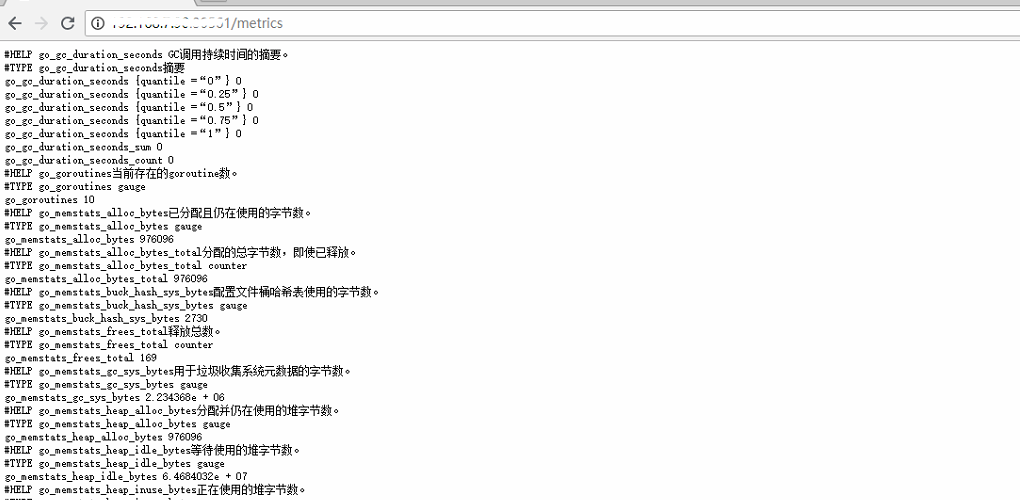
自带 metrics 端点的服务1 2 3 4 prometheus.io/host : calico-etcd # 服务名称 prometheus.io/port : "6666" # metrics 端口 prometheus.io/scrape : "true" # 抓取开关 prometheus.io/path : "/metrics"默认为/metric
完整的kubernetes部署文件 1 2 3 4 5 6 7 8 9 10 11 12 13 14 15 16 17 18 19 20 21 22 23 24 25 26 27 28 29 30 31 32 33 34 35 36 37 38 39 40 41 42 43 44 45 46 47 48 49 50 51 52 53 54 55 56 57 58 59 60 61 62 63 64 65 66 67 68 69 70 71 blackbox-exporter-deploy.yaml apiVersion: extensions/v1beta1kind: Deploymentmetadata: name: prometheus-blackbox-exporter namespace: monitoringspec: selector: matchLabels: app: prometheus-blackbox-exporter replicas: 1 template: metadata: labels: app: prometheus-blackbox-exporter spec: restartPolicy: Always containers: - name: prometheus-blackbox-exporter image: prom/blackbox-exporter: v0.12 .0 imagePullPolicy: IfNotPresent ports: - name: blackbox-port containerPort: 9115 readinessProbe: tcpSocket: port: 9115 initialDelaySeconds: 5 timeoutSeconds: 5 resources: requests: memory: 50 Mi cpu: 100 m limits: memory: 60 Mi cpu: 200 m volumeMounts: - name: config mountPath: /etc/ blackbox_exporter args: - --config.file=/etc/ blackbox_exporter/blackbox.yml - --log.level=debug - --web.listen-address=:9115 volumes: - name: config configMap: name: prometheus-blackbox-exporter nodeSelector: prometheus: "core" tolerations: - key: "node-role.kubernetes.io/master" effect: "NoSchedule" --- apiVersion: v1kind: Servicemetadata: labels: app: prometheus-blackbox-exporter name: blackbox-exporter namespace: monitoring annotations: prometheus.io/scrape: 'true' spec: type: NodePort selector: app: prometheus-blackbox-exporter ports: - name: blackbox port: 9115 targetPort: 9115 protocol: TCP
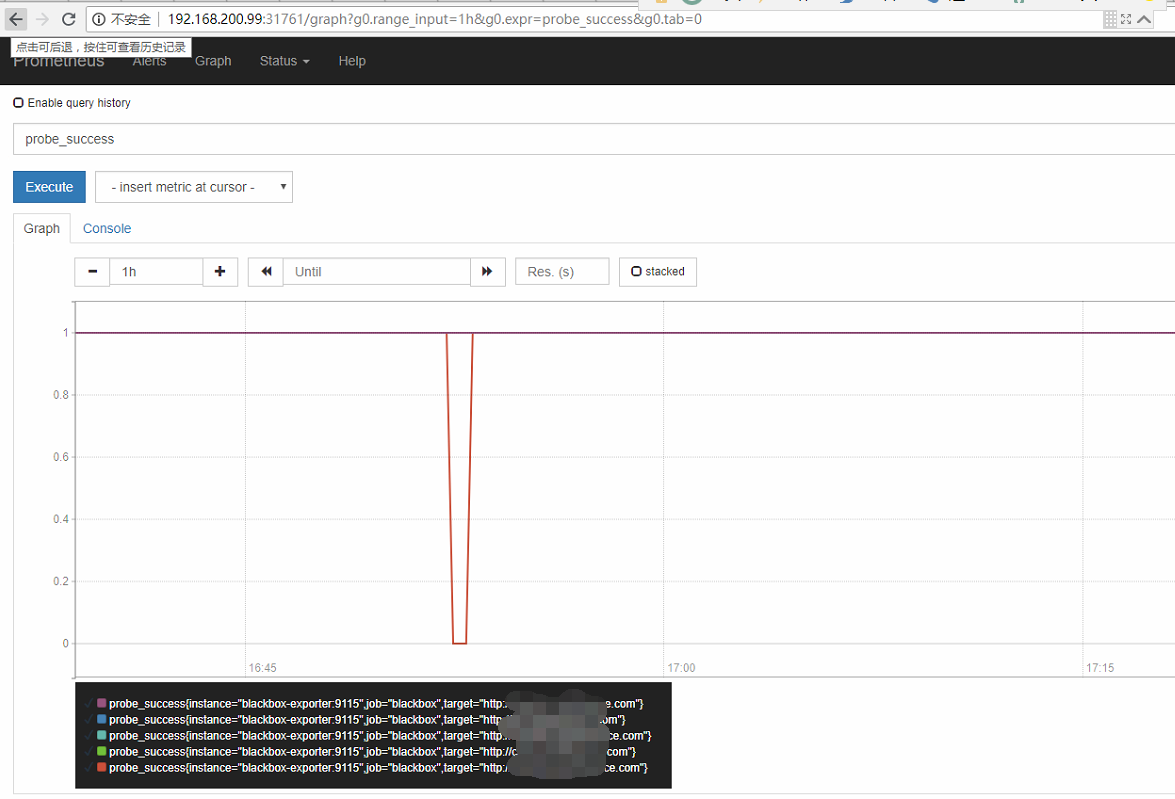
prometheus的配置文件 1 2 3 4 5 6 7 8 9 10 11 12 13 14 15 16 - job_name: 'blackbox' params: module: [http_2xx] # Look for a HTTP 200 response. static_configs: - targets: http: //prometheus.io # Target to probe with http. - https:/ /prometheus.io # Target to probe with https. http:/ /example.com:8080 # Target to probe with http on port 8080. - source_labels: [__address__] - source_labels: [__param_target] - target_label: __address__
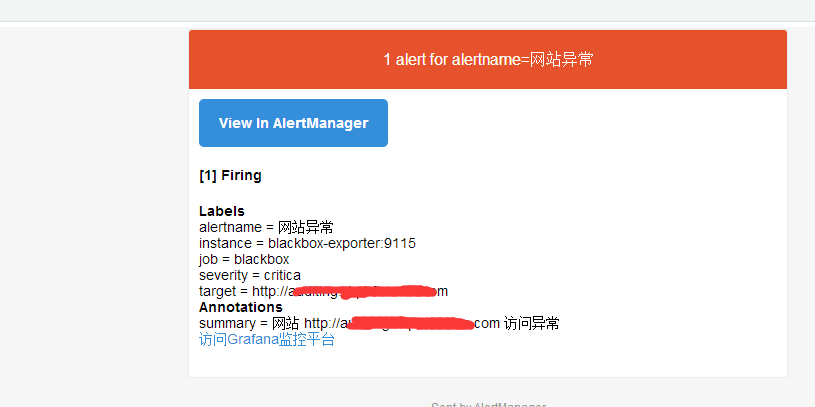
prometheus的配置文件alermanager报警规则 1 2 3 4 5 6 7 8 9 - name: sitealer rules: - alert: 网站异常 expr: up{job="blackbox" } == 0 or probe_success{job="blackbox" } == 0 for : 10 s labels: severity: critica annotations: summary: "网站 {{ $labels.target }} 访问异常"