使用Prometheus的blackbox_exporter进行网络监控
- Prometheus提供了一个blackbox_exporter可以实现网络监控,支持http、dns、tcp、icmp等监控。
其中9115是这个exporter的http端点的监听端口,blackbox.yml是它的配置文件,需要在其中使用blackbox_exporter的http、dns、tcp、icmp等prober定制配置出各种监测模块(module)。关于blackbox_exporter的配置具体参考Blackbox exporter configuration和Blackbox exporter configuration Exmaple。下面的例子是一个最基本的配置:1
2
3
4
5
6
7
8
9
10
11
12
13
14
15
16
17
18
19
20modules:
http_2xx: # http 监测模块
prober: http
http:
http_post_2xx: # http post 监测模块
prober: http
http:
method: POST
tcp_connect: # tcp 监测模块
prober: tcp
ping: # icmp 检测模块
prober: icmp
timeout: 5s
icmp:
preferred_ip_protocol: "ip4"
dns:
transport_protocol: "tcp"
preferred_ip_protocol: "ip4"
query_name: "kubernetes.default.svc.cloud.ctrm" # 利用这个域名来检查 dns 服务器
query_type: "A" # 如果是 kube-dns ,一定要加入这个
在Prometheus的配置文件中配置使用ping module:1
2
3
4
5
6
7
8
9
10
11
12
13
14
15
16
17
18
19- job_name: 'ping_all'
scrape_interval: 1m
metrics_path: /probe
params:
module: [ping]
static_configs:
- targets:
- 192.168.1.2
labels:
instance: node2
- targets:
- 192.168.1.3
labels:
instance: node3
relabel_configs:
- source_labels: [__address__]
target_label: __param_target
- target_label: __address__
replacement: 127.0.0.1:9115 # black_exporter服务器的地址
测试
curl “http://127.0.0.1:9115/probe?module=ping&target=192.168.1.2“
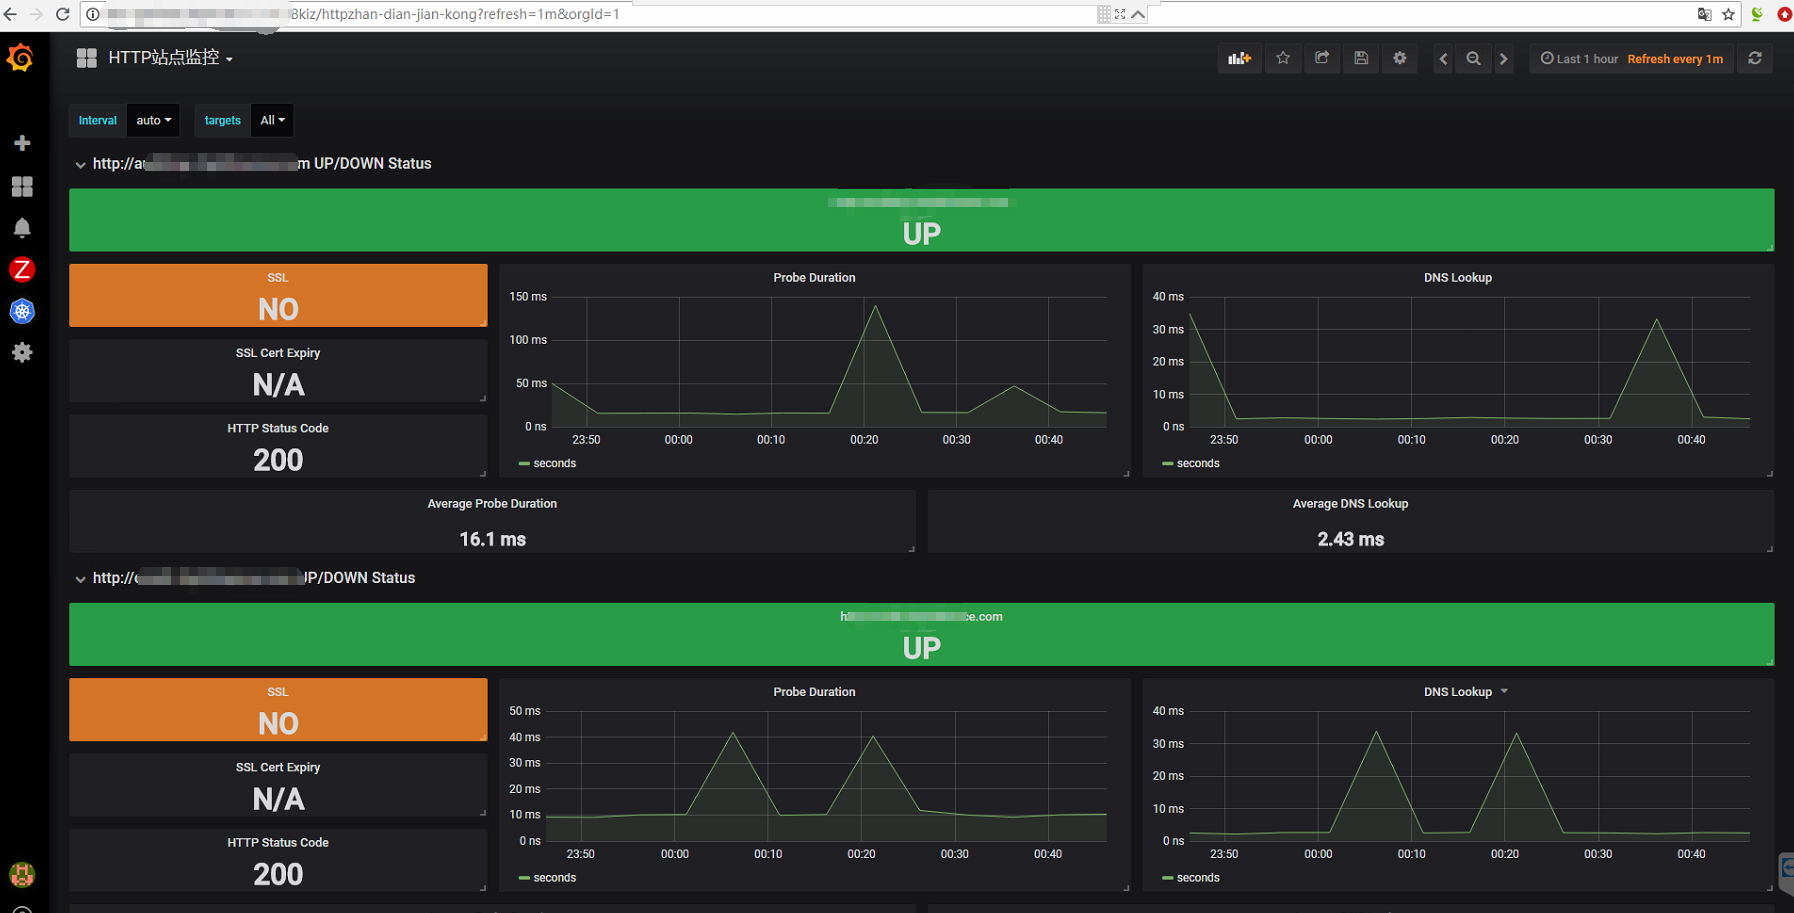
http检测
Blackbox 配置了 http_2xx 模块,所以这里只需要在 Prometheus的配置文件中配置使用http_2xx module1
2
3
4
5
6
7
8
9
10
11
12
13
14
15
16- job_name: 'blackbox'
metrics_path: /probe
params:
module: [http_2xx] # Look for a HTTP 200 response.
static_configs:
- targets:
- http://prometheus.io # Target to probe with http.
- https://prometheus.io # Target to probe with https.
- http://example.com:8080 # Target to probe with http on port 8080.
relabel_configs:
- source_labels: [__address__]
target_label: __param_target
- source_labels: [__param_target]
target_label: instance
- target_label: __address__
replacement: 127.0.0.1:9115 # The blackbox exporter's real hostname:port
dns监控1
2
3
4
5
6
7
8
9
10
11
12
13
14- job_name: "kubernetes-service-dns"
metrics_path: /probe # 不是 metrics,是 probe
params:
module: [dns] # DNS 模块
static_configs:
- targets:
- kube-dns:53 # 不要省略端口号
relabel_configs:
- source_labels: [__address__]
target_label: __param_target
- source_labels: [__param_target]
target_label: instance
- target_label: __address__
replacement: blackbox # 服务地址,和上面的 Service 定义保持一致
/-/reload(curl -XPOST ip:prom端口/-/reload)使配置生效
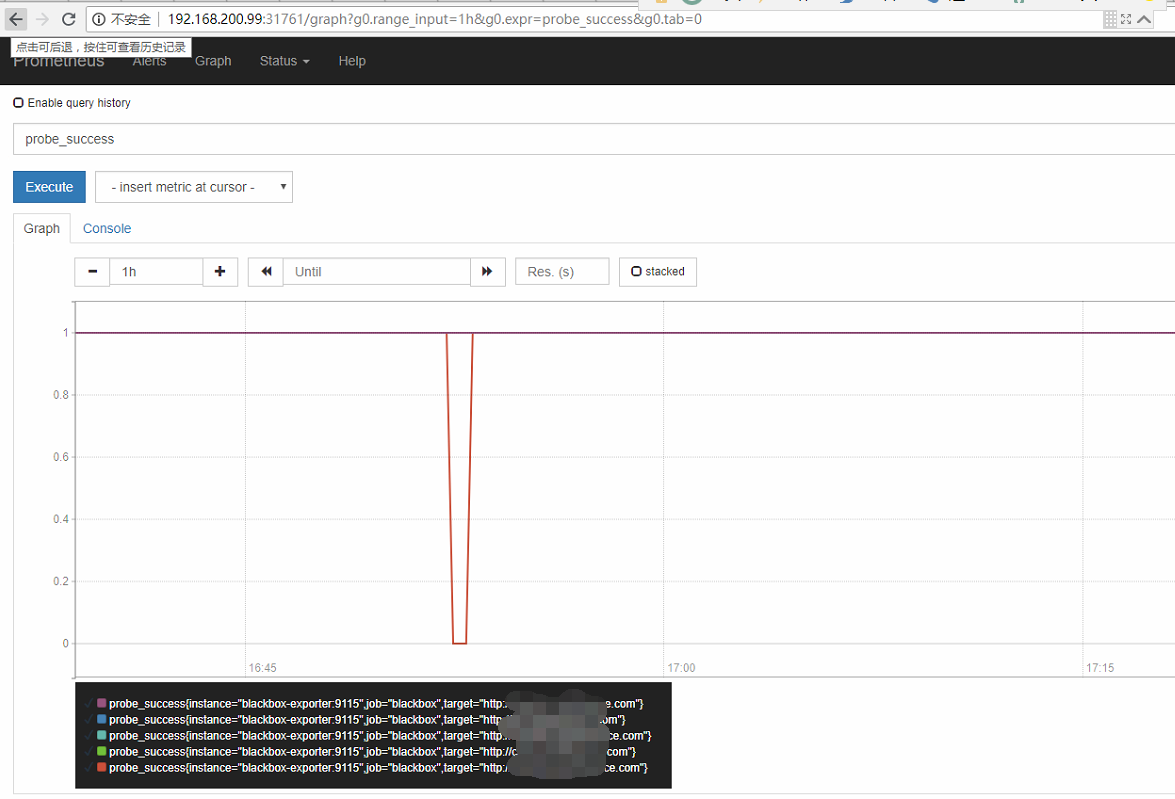
可以使用 probe_success{job=”kubernetes-service-dns”} 查看结果
如果HTTP服务启用了安全认证,Blockbox Exporter内置了对basic_auth的支持,可以直接设置相关的认证信息即可:1
2
3
4
5
6
7
8
9
10http_basic_auth_example:
prober: http
timeout: 5s
http:
method: POST
headers:
Host: "login.example.com"
basic_auth:
username: "username"
password: "mysecret"
对于使用了Bear Token的服务也可以通过bearer_token配置项直接指定令牌字符串,或者通过bearer_token_file指定令牌文件。
对于一些启用了HTTPS的服务,但是需要自定义证书的服务,可以通过tls_config指定相关的证书信息:1
2
3
4
5
6http_custom_ca_example:
prober: http
http:
method: GET
tls_config:
ca_file: "/certs/my_cert.crt"
自带 metrics 端点的服务
有的服务,例如 prometheus 或者 blackbox,以及 kube-dns、etcd 等, 都是自有 /metrics 提供指标输出的,这种服务对 Blackbox + Prometheus 组合是非常方便的。
只要给服务的注解部分加入几个标签:
kubernetes-pods
对于pod的监测也是需要加注解:1
2
3
4prometheus.io/host: calico-etcd # 服务名称
prometheus.io/port: "6666" # metrics 端口
prometheus.io/scrape: "true" # 抓取开关
prometheus.io/path: "/metrics"默认为/metric
完整的kubernetes部署文件
1 | blackbox-exporter-deploy.yaml |
prometheus的配置文件
1 | - job_name: 'blackbox' |
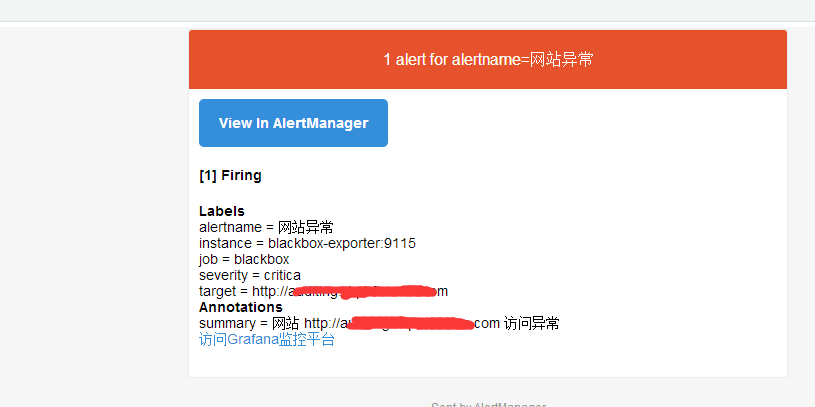
prometheus的配置文件alermanager报警规则
1 | - name: sitealer |