haproxy配置
json格式输出日志到rsyslog日志格式不一定要按照我这个配置。1
2
3
4
5
6
7
8
9
10
11
12
13
14
15
16
17
18
19
20
21haproxy.cfg
global
# to have these messages end up in /var/log/haproxy.log you will
# need to:
#
# 1) configure syslog to accept network log events. This is done
# by adding the '-r' option to the SYSLOGD_OPTIONS in
# /etc/sysconfig/syslog
#
# 2) configure local2 events to go to the /var/log/haproxy.log
# file. A line like the following can be added to
# /etc/sysconfig/syslog
#
# local2.* /var/log/haproxy.log
#
log 127.0.0.1 local3
log-format {"haproxy_dateTime":"%t","haproxy_clientIP":"%ci","haproxy_backendSourceIP":"%bi","http_request":"%r","reponse_headers":"%hrl","status_code":%ST,"haproxy_bytesRead":"%B","haproxy_serverName":"%s","haproxy_Tw":"%Tw","haproxy_Tc":"%Tc","haproxy_Tt":"%Tt"}
---
cat /etc/rsyslog.conf
local3.* @@192.168.200.75:516
lostash配置
1 | [root@loanaudit02 zhphuser]# cat /etc/logstash/conf.d/haproxy.conf |
index必须以logstash开头
geoip配置
1 | 在logstash服务器下载IP地址归类查询库 |
配置kibana
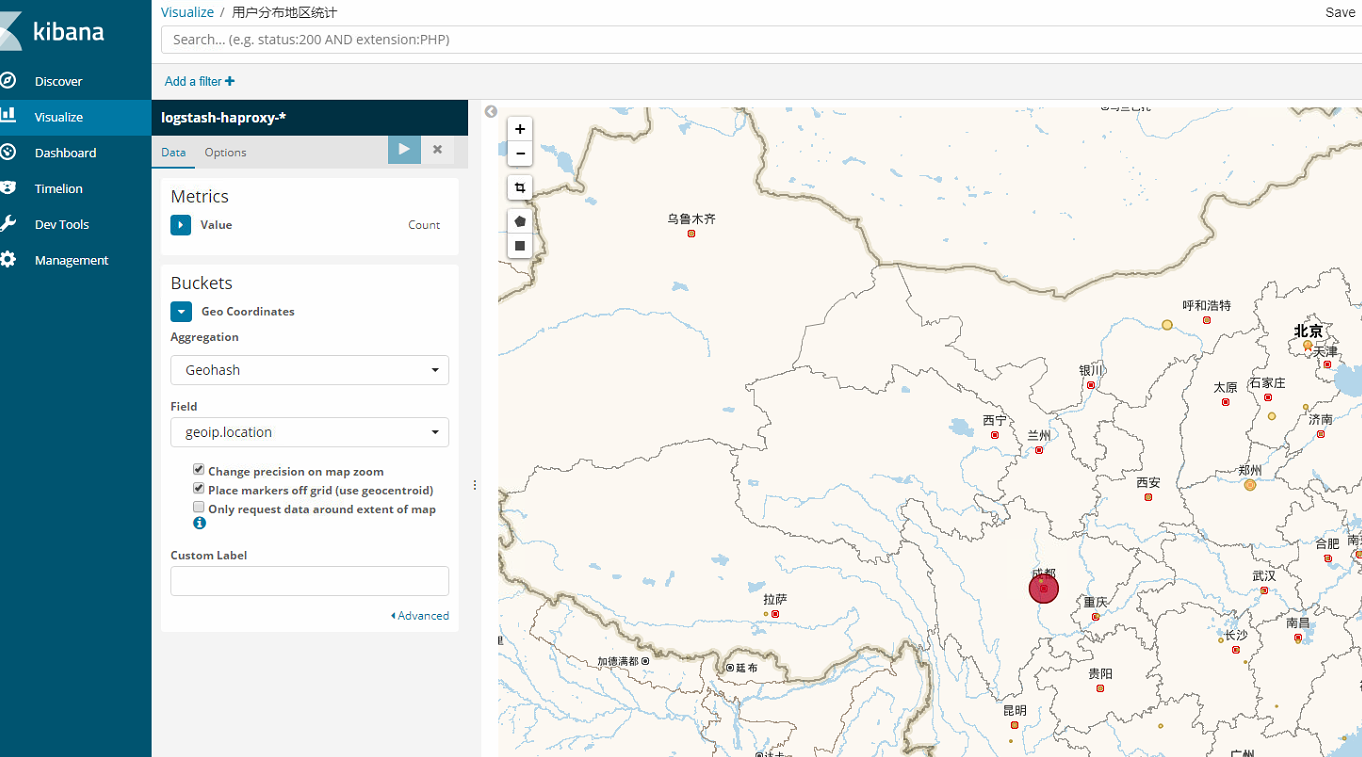
1 | kibana使用地图统计ip访问地域 |
下面是kibana自带的几种visualize类型
类型 用途
Area chart 用区块图来可视化多个不同序列的总体贡献。
Data table 用数据表来显示聚合的原始数据。其他可视化可以通过点击底部的方式显示数据表。
Line chart 用折线图来比较不同序列。
Markdown widget 用 Markdown 显示自定义格式的信息或和你仪表盘有关的用法说明。
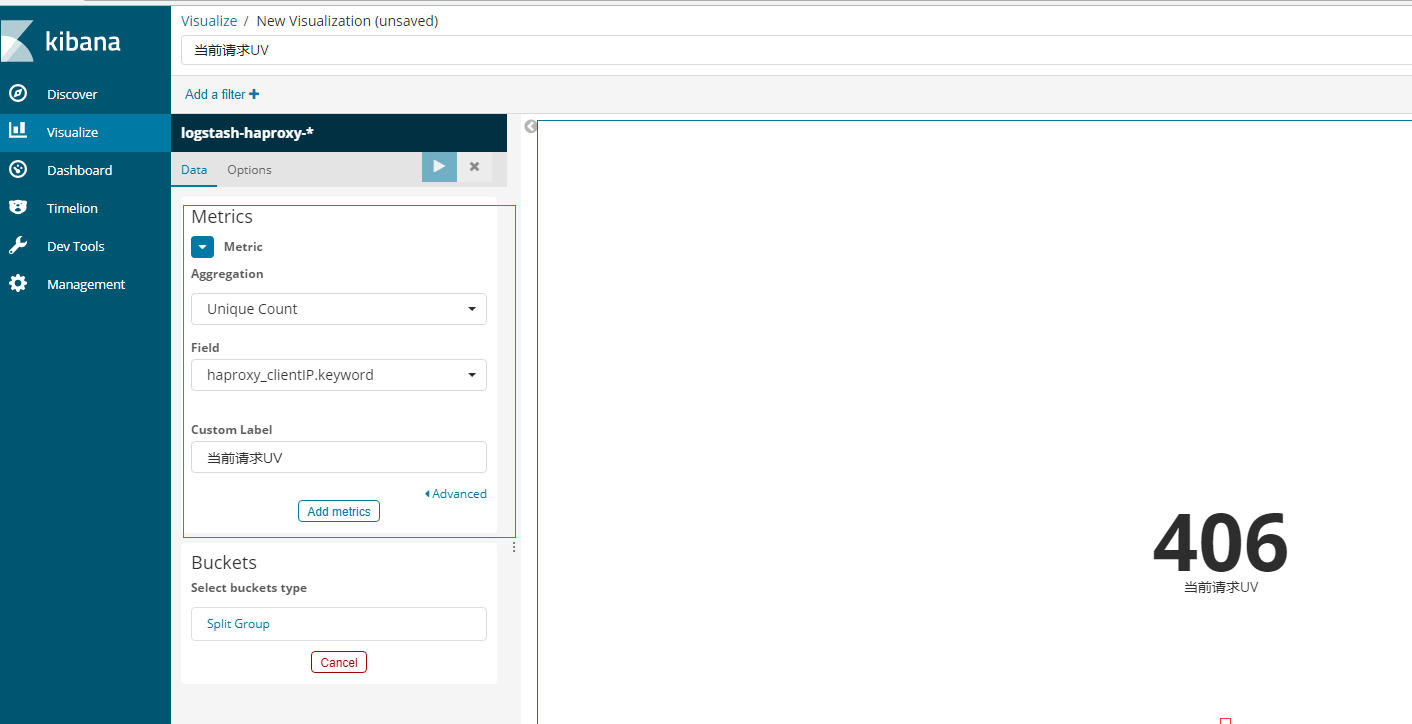
Metric 用指标可视化在你仪表盘上显示单个数字。
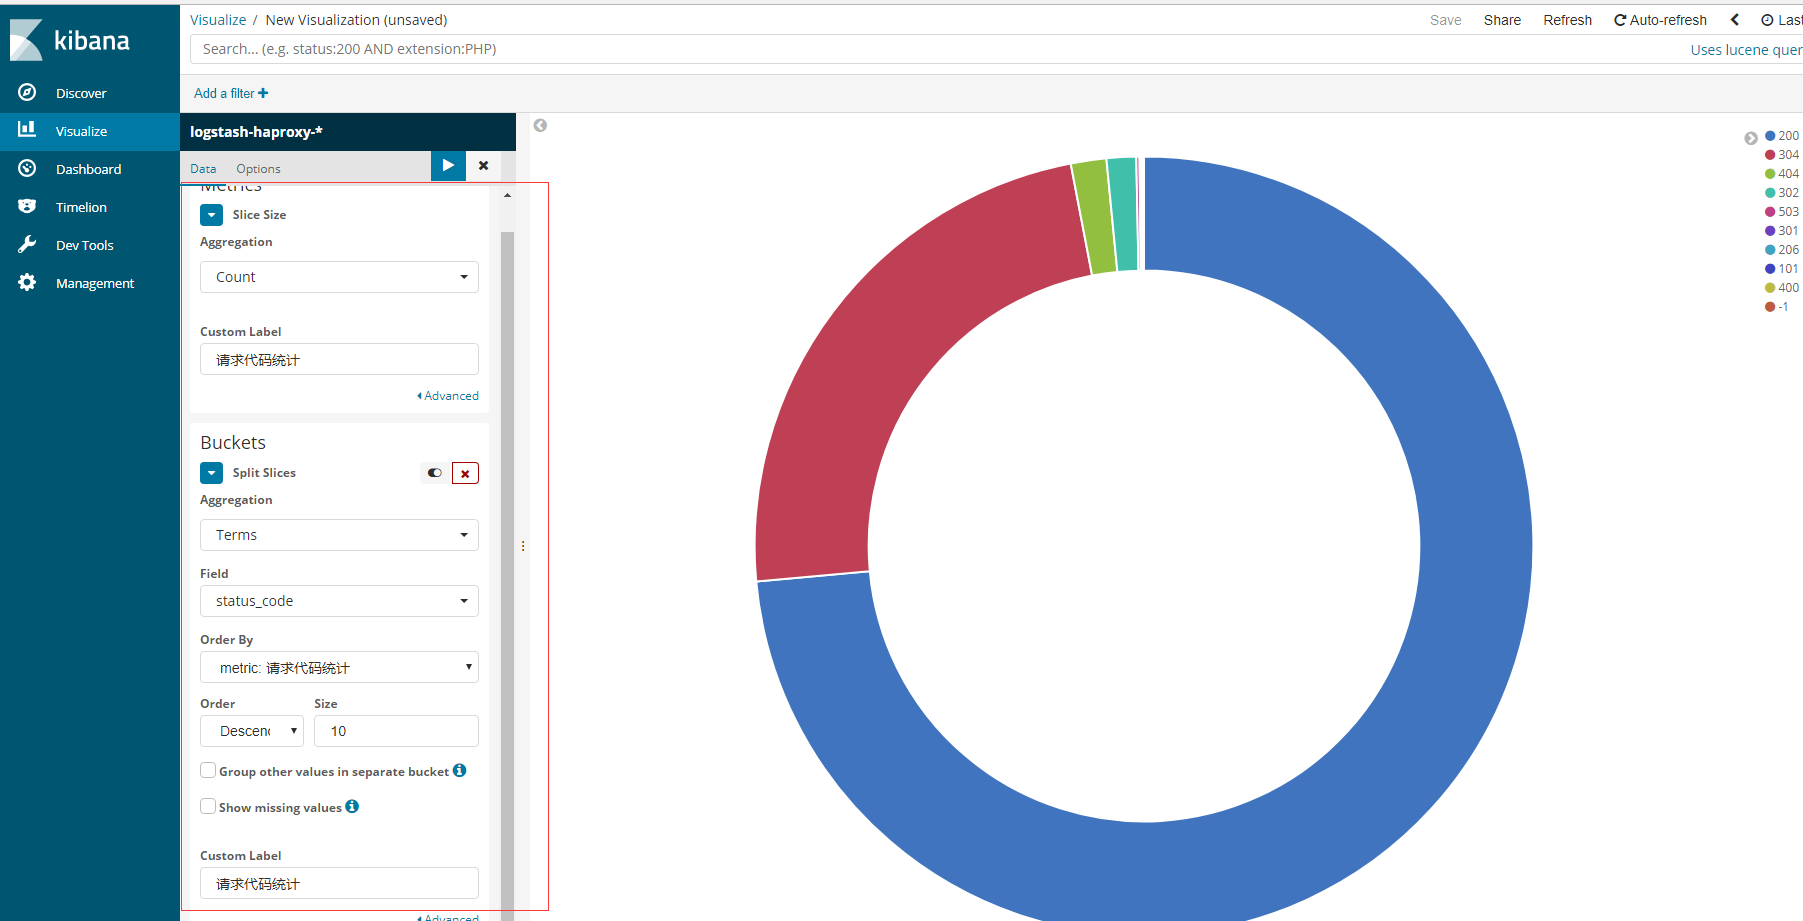
Pie chart 用饼图来显示每个来源对总体的贡献。
Tile map 用瓦片地图将聚合结果和经纬度联系起来。
Vertical bar chart 用垂直条形图作为一个通用图形。
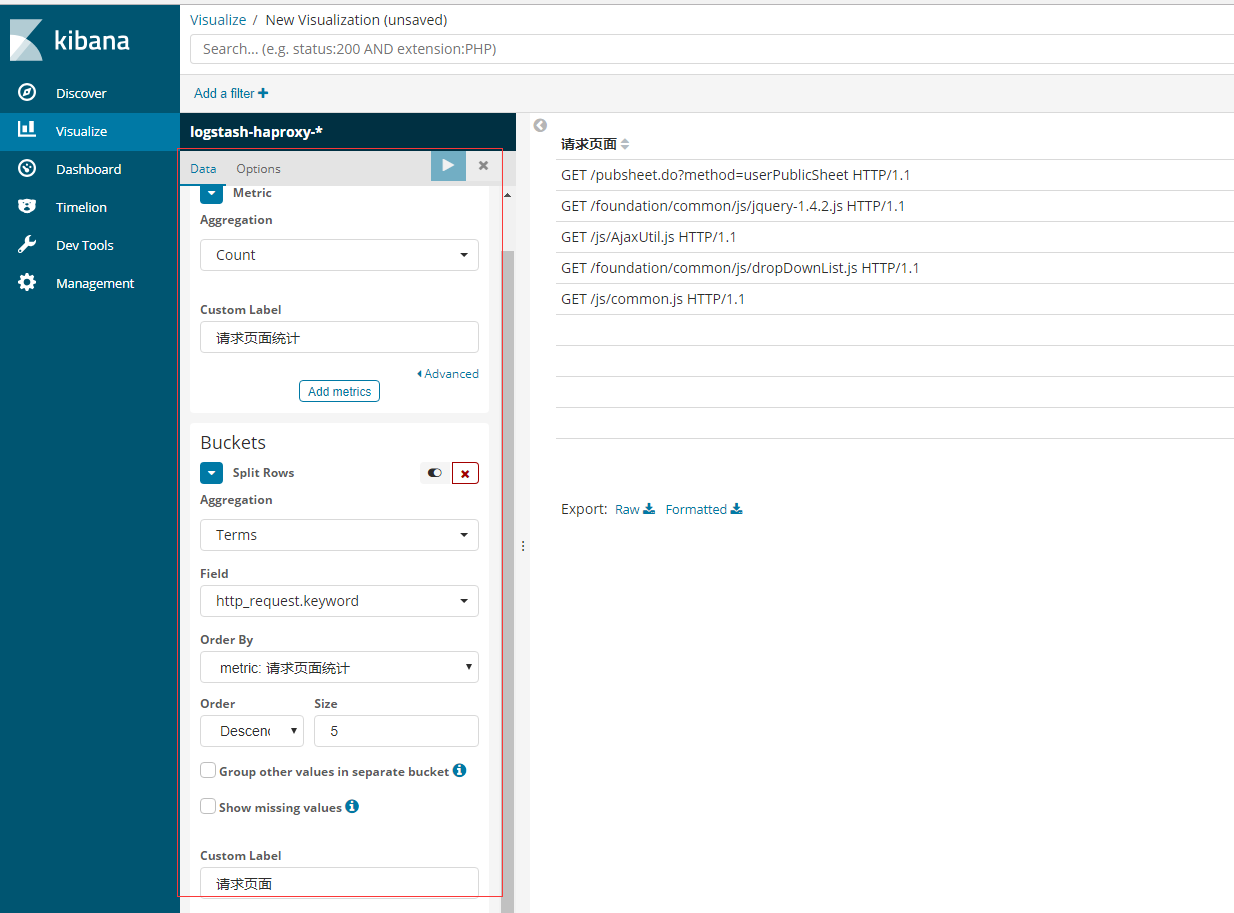
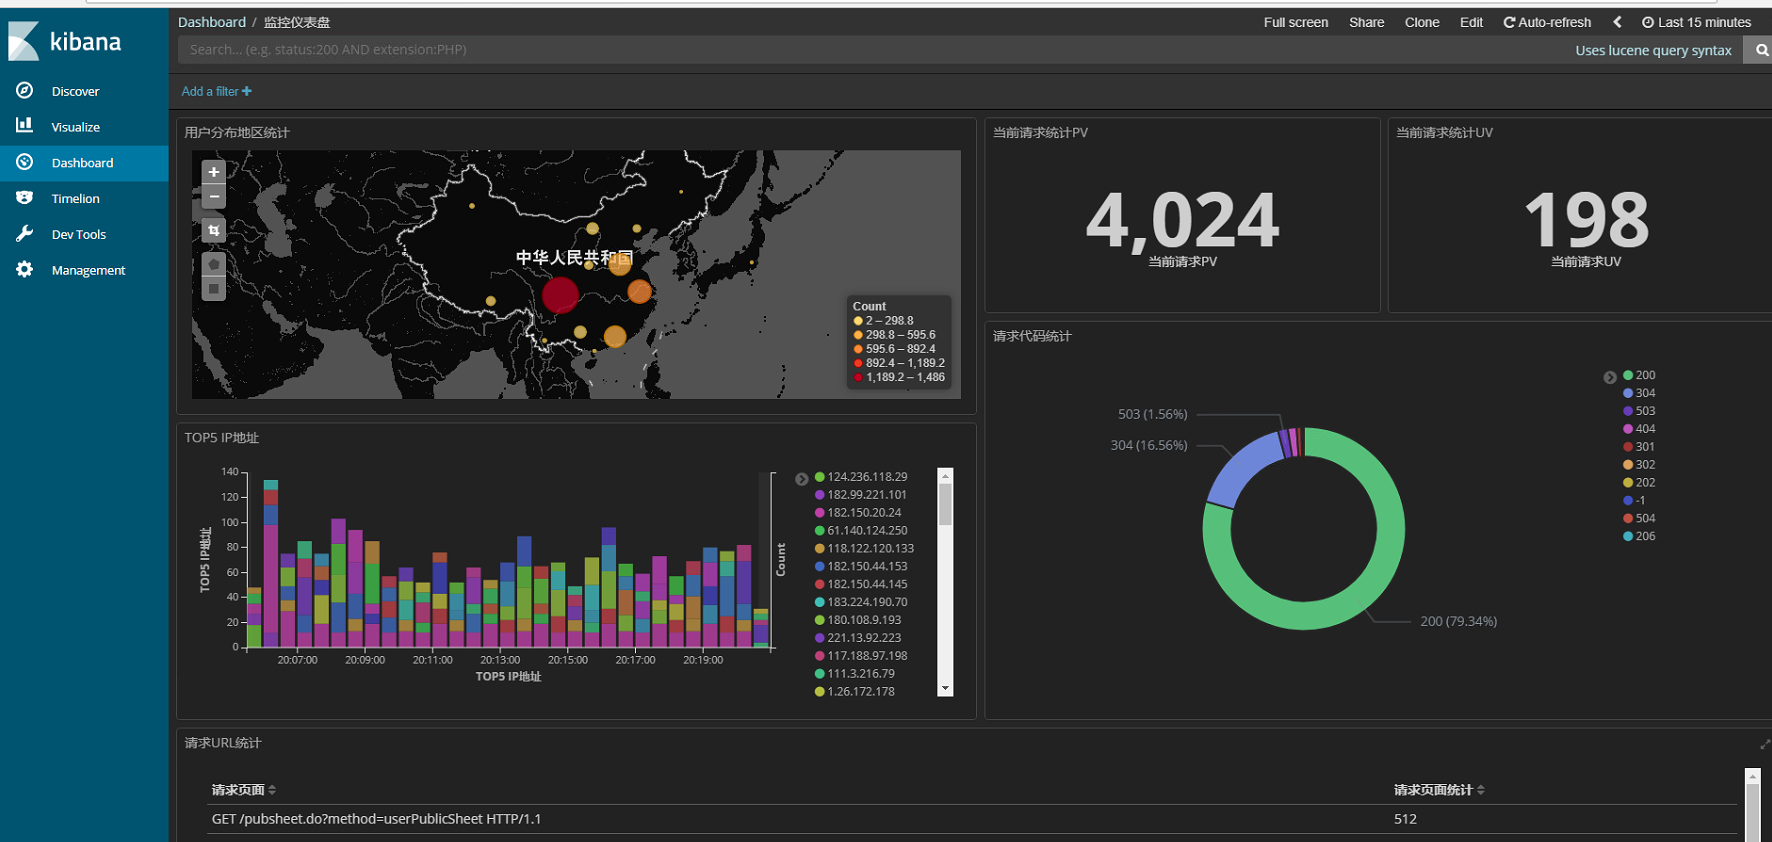
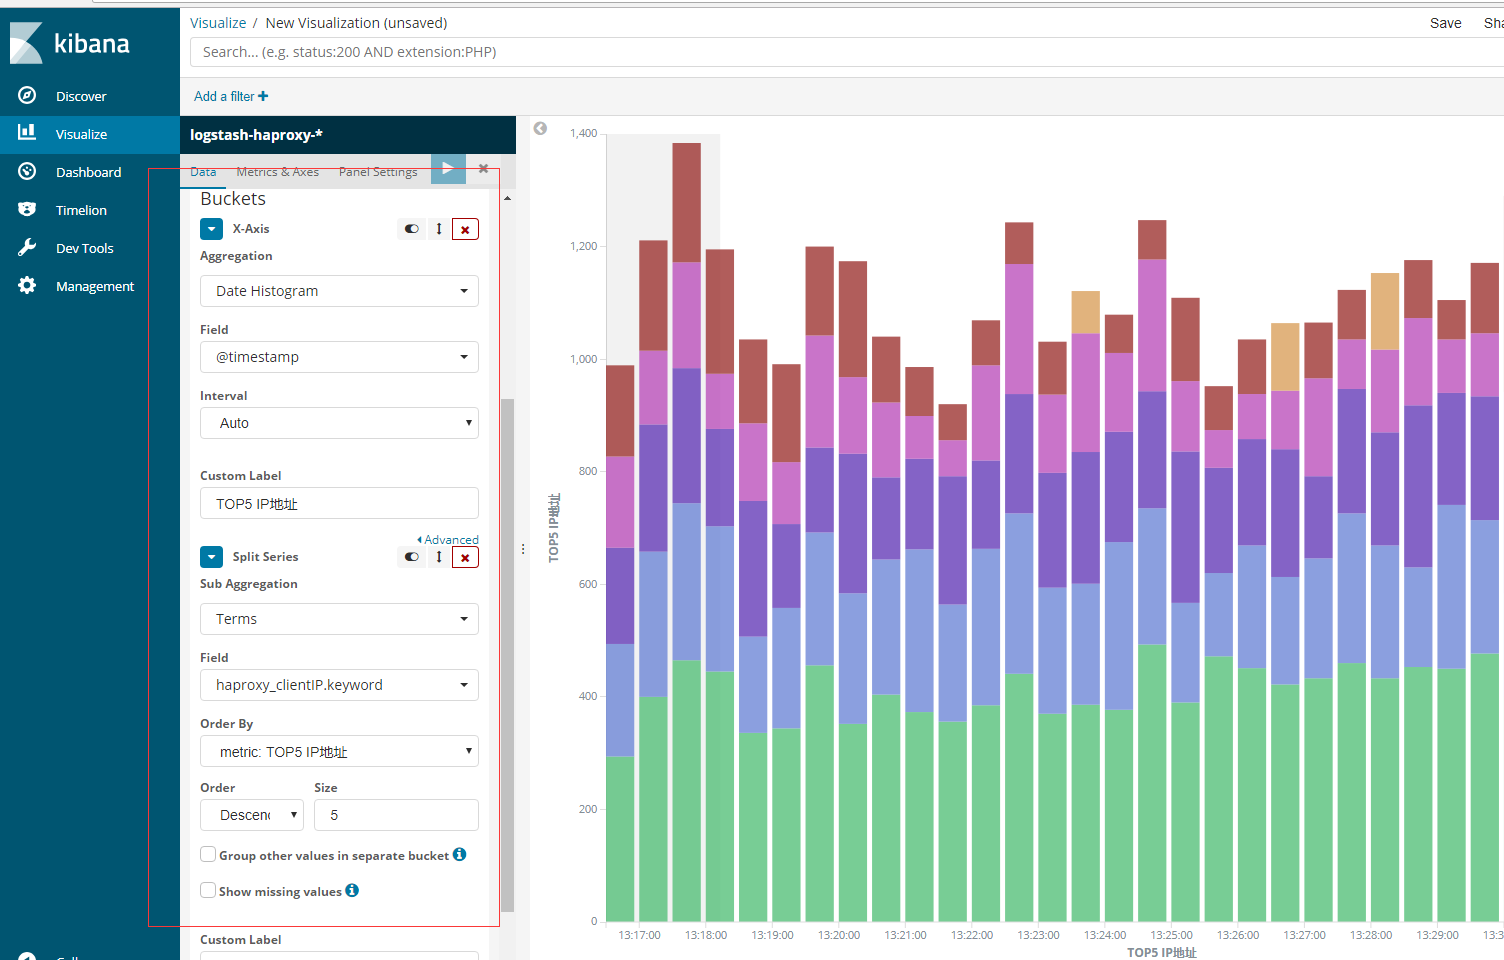
top5ip统计
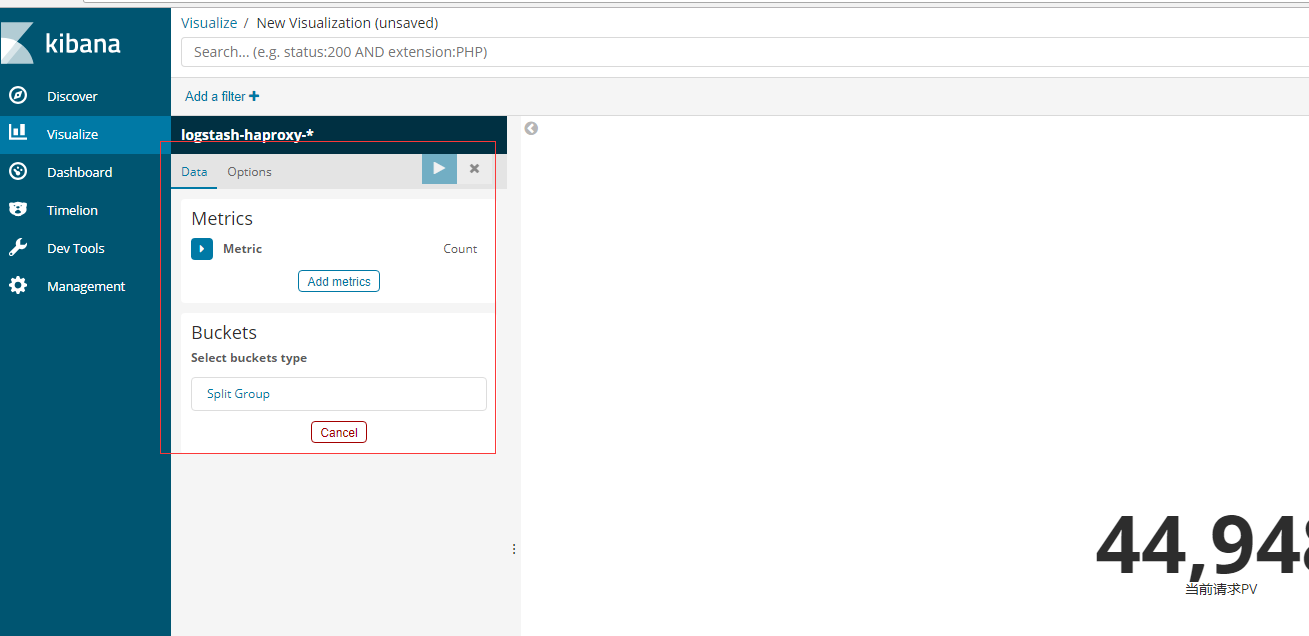
当前请求pv
当前请求UV
公网ip地址分布
请求响应代码统计
请求URL统计