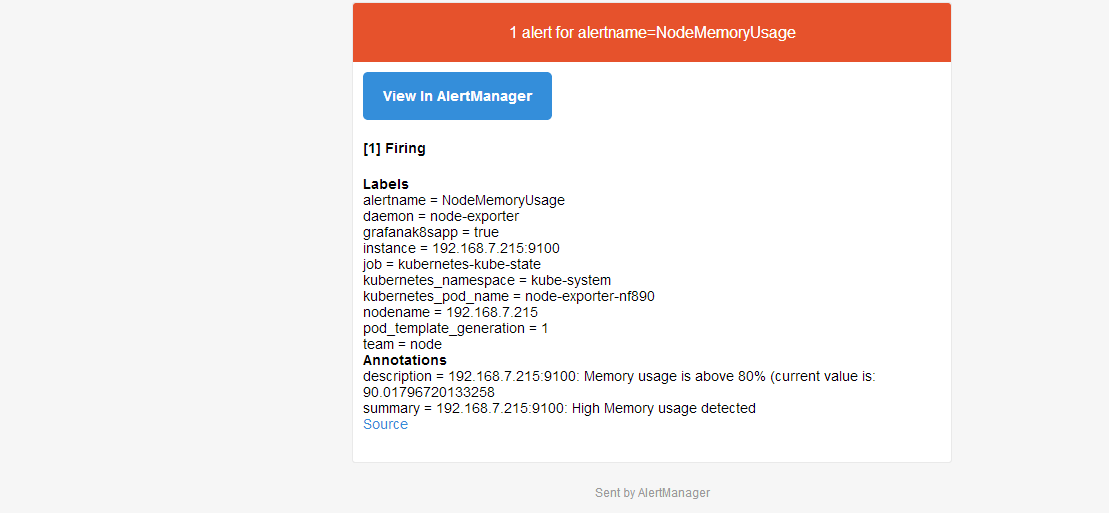
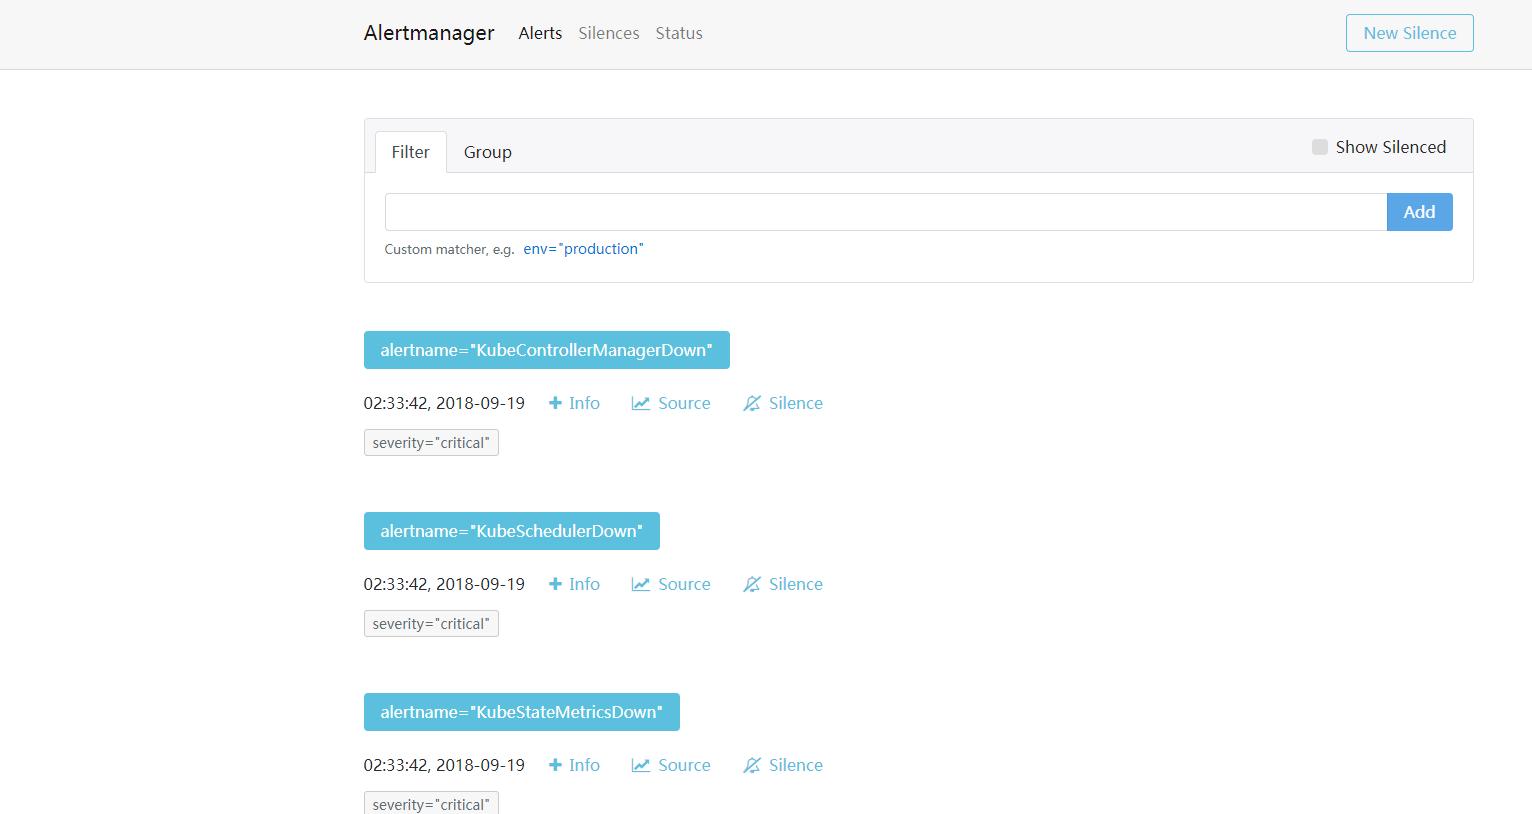
prometheus将监测到的异常事件发送给alertmanager,alertmanager发送异常事件的通知(邮件、webhook等)
configMap.yaml文件
随便注释一部分具体参数参考官方
1
2
3
4
5
6
7
8
9
10
11
12
13
14
15
16
17
18
19
20
21
22
23
24
25
26
27
28
29
30
31
32
33
| apiVersion: v1
kind: ConfigMap
metadata:
name: alertmanager
namespace: monitoring
data:
config.yml: |-
global:
smtp_smarthost: 'smtp.idcsec.com:25' # Email SMTP 服务器信息
smtp_from: 'root@idcsec.com'
smtp_auth_username: 'root@idcsec.com'
smtp_auth_password: 'pwd'
resolve_timeout: 10m
smtp_require_tls: false #是否开启 TLS
route: # 路由规则配置将不同告警发送给指定人
group_by: ['alertname'] # 告警压缩规则
repeat_interval: 24h
receiver: monitoring #默认发送到 `monitoring`,该 monitoring 必须存在,否则报错退出
routes: # 子路由告警级别分别发给不同的接收器
- match:
team:dba #匹配prometheus的rule_files文件中的labels
receiver: db-team-email receiver接收器名称 全局唯一
continue: true # 默认告警匹配成功第一个 receivers 会退出匹配,开启 continue 参数后会继续匹配 receivers 列表
receivers: # 接收器
- name: 'monitoring'
email_configs:
- send_resolved: true #告警恢复后否发送通知,这里选择发送
to: 'test@idcsec.com' #接收邮件'A@.com,B@com'
- name: 'db-team-email'
email_configs:
- send_resolved: true
to:'xxx@xxx.com'
|
alertmanager.yaml文件
1
2
3
4
5
6
7
8
9
10
11
12
13
14
15
16
17
18
19
20
21
22
23
24
25
26
27
28
29
30
31
32
33
34
35
36
37
38
39
40
41
42
43
44
45
46
47
48
49
50
51
52
53
54
55
56
57
58
59
60
61
62
63
64
65
66
67
68
69
70
71
72
73
74
75
76
77
78
79
80
81
82
| apiVersion: extensions/v1beta1
kind: Deployment
metadata:
annotations:
deployment.kubernetes.io/revision: "3"
creationTimestamp: 2018-07-31T13:08:06Z
generation: 3
labels:
app: alertmanager
name: alertmanager
namespace: monitoring
resourceVersion: "43603292"
selfLink: /apis/extensions/v1beta1/namespaces/monitoring/deployments/alertmanager
uid: c3c75e6c-94c2-11e8-b5ba-1866daeddaa4
spec:
replicas: 1
selector:
matchLabels:
app: alertmanager
strategy:
rollingUpdate:
maxSurge: 1
maxUnavailable: 1
type: RollingUpdate
template:
metadata:
creationTimestamp: null
labels:
app: alertmanager
name: alertmanager
spec:
containers:
- args:
- -config.file=/etc/alertmanager/config.yml
- -storage.path=/alertmanager
image: alertmanager:v0.7.1
imagePullPolicy: IfNotPresent
name: alertmanager
ports:
- containerPort: 9093
name: alertmanager
protocol: TCP
resources: {}
terminationMessagePath: /dev/termination-log
terminationMessagePolicy: File
volumeMounts:
- mountPath: /etc/alertmanager
name: config-volume
- mountPath: /etc/alertmanager-templates
name: templates-volume
- mountPath: /alertmanager
name: alertmanager
dnsPolicy: ClusterFirst
restartPolicy: Always
schedulerName: default-scheduler
securityContext: {}
terminationGracePeriodSeconds: 30
volumes:
- configMap:
defaultMode: 420
name: alertmanager
name: config-volume
- configMap:
defaultMode: 420
name: alertmanager-templates
name: templates-volume
- emptyDir: {}
name: alertmanager
status:
availableReplicas: 1
conditions:
- lastTransitionTime: 2018-07-31T13:08:06Z
lastUpdateTime: 2018-07-31T13:08:06Z
message: Deployment has minimum availability.
reason: MinimumReplicasAvailable
status: "True"
type: Available
observedGeneration: 3
readyReplicas: 1
replicas: 1
updatedReplicas: 1
---
|
部署Prometheus alertmanager相关配置文件
在prometheus.yml中指定规则文件(可使用通配符,如rules/*.rules)这使用 rules.yaml
1
2
3
4
5
6
7
8
9
10
11
12
13
14
15
16
17
18
19
20
21
22
23
24
25
26
27
28
29
30
31
32
33
34
35
36
37
38
39
40
41
42
43
44
45
46
47
48
49
50
51
52
53
54
55
56
57
58
59
60
61
| apiVersion: v1
kind: ConfigMap
metadata:
name: prometheus-config
labels:
name: prometheus-config
namespace: monitoring
data:
prometheus.yml: |
global:
scrape_interval: 15s
evaluation_interval: 15s
alerting:
alertmanagers:
- static_configs:
- targets: ["alertmanager:9093"]
rule_files:
- "rules.yml"
scrape_configs:
..........
rules.yml: |-
groups:
- name: noah_pod.rules
rules:
- alert: Pod_all_cpu_usage
expr: (sum by(name)(rate(container_cpu_usage_seconds_total{image!=""}[5m]))*100) > 10
for: 5m
labels:
severity: critical
service: pods
annotations:
description: 容器 {{ $labels.name }} CPU 资源利用率大于 75% , (current value is {{ $value }})
summary: Dev CPU 负载告警
- alert: Pod_all_memory_usage
expr: sort_desc(avg by(name)(irate(container_memory_usage_bytes{name!=""}[5m]))*100) > 1024*10^3*2
for: 10m
labels:
severity: critical
annotations:
description: 容器 {{ $labels.name }} Memory 资源利用率大于 2G , (current value is {{ $value }})
summary: Dev Memory 负载告警
- alert: Pod_all_network_receive_usage
expr: sum by (name)(irate(container_network_receive_bytes_total{container_name="POD"}[1m])) > 1024*1024*50
for: 10m
labels:
severity: critical
annotations:
description: 容器 {{ $labels.name }} network_receive 资源利用率大于 50M , (current value is {{ $value }})
summary: network_receive 负载告警
- name: Oracle.rules
rules:
- alert: Oracledb-status
expr: oracledb_up{job="oracle-198"} == 0
for: 60s
labels:
severity: critica
team:dba
annotations:
summary: 数据库 {{ $labels.instance }} 告警
description: "数据库 {{ $labels.instance }} 异常 (当前值: {{ $value }}"
|
更新prometheus的配置需要让重新读取,有两种方法:
1、通过HTTP API向/-/reload发送POST请求,例:curl -X POST http://ip:9090/-/reload
2、向prometheus进程发送SIGHUP信号