使用redis_exporter采集Redis指标通过prometheus抓取数据展示Grafana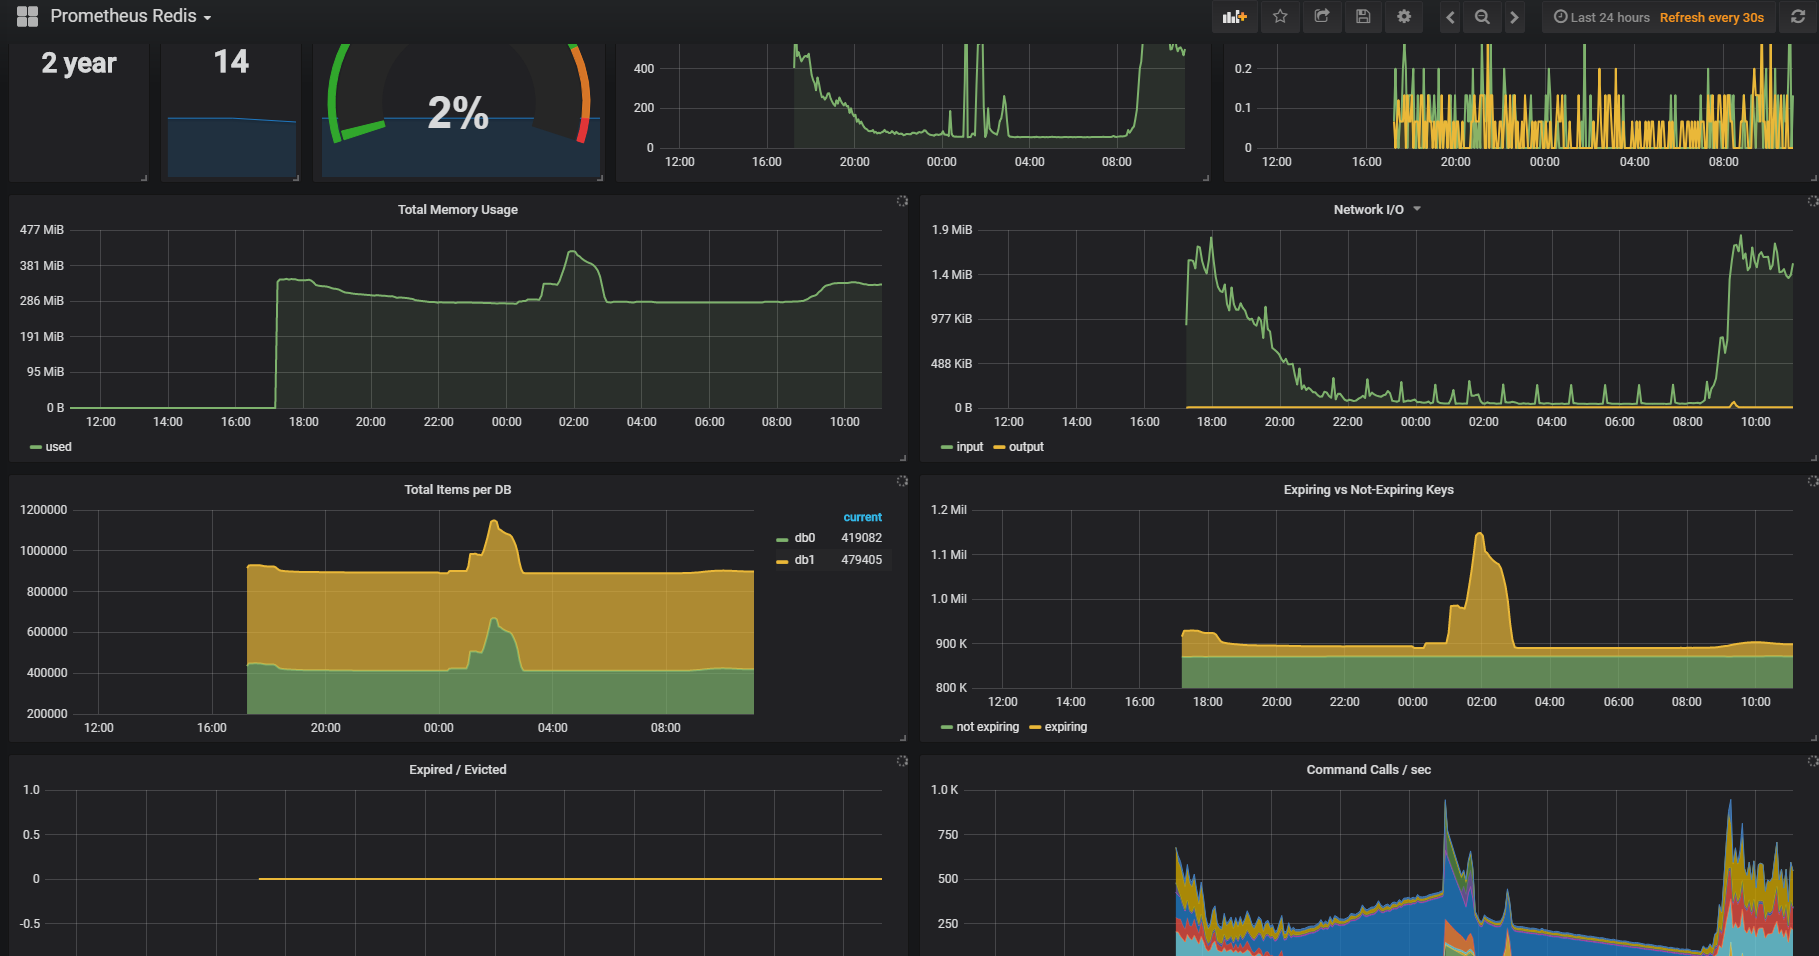
exporter安装
1 | wget https://github.com/oliver006/redis_exporter/releases/download/v0.23.0/redis_exporter-v0.23.0.linux-amd64.tar.gz |
启动redis_exporter:
1 | redis_exporter -redis.addr 192.168.2.1:7000 -redis.password 123456 -web.listen-address 192.168.2.1:9121 |
grafana的redis的模板id763:https://grafana.com/dashboards/763
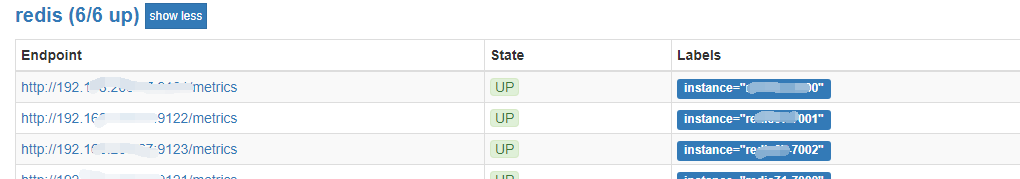
prometheus.yml加入redis节点,然后重启prometheus:1
2
3
4
5
6
7
8
9
10
11- job_name: redis
static_configs:
- targets: ['192.168.2.1:9121']
labels:
instance: redis-7000
- targets: ['192.168.2.1:9122']
labels:
instance: redis-7001
- targets: ['192.168.2.1:9123']
labels:
instance: redis-7002
curl -XPOST http://ip/-/reload